The SafeWorkPro Safety Management Dashboard
No matter the type of industry, whether it’s mining, construction, manufacturing or even basic labour, risk is a constantly evolving threat. Dangers associated with any type of work threaten not only the well-being of workers, but also how productive and profitable a business can be.
The logic is simple. An effective and efficient OHS management system will result in quicker, safer and more compliant safety procedures. This means workers spend less time writing safety documents and more time getting the job done. Moreover, an efficient management system gives safety managers the tools to improve safe work practices and boost productivity.
Therefore safe systems of work need to be established which are smart and flexible enough to adapt with continually changing workplace environments. Previously on the SafeWorkPro Blog, we’ve written about how our software empowers managers and workers to create their own safety documents but now there is another feature which produces even better OHS results.
The Dashboard: using data driven decision-making to improve OHS procedures
A decision that is backed up by strong data will always produce better results. That’s why the dashboard feature has been implemented into the SafeWorkPro software. The dashboard is a place for managers to track the progress of their OHS policies and procedures, and see how well these are actually being implemented. Data relating to what safety document was used for a job, who completed it and the risk involved, are just some of the business insights that the dashboard feature provides. In all, four components break the data down into easy to understand terms.
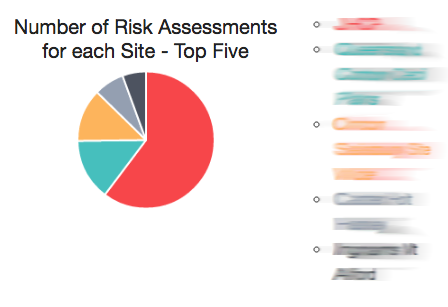
1: The number of safety documents for each site
Understanding what safety documents are being used for which job site is important for helping managers keep their finger on the pulse of a business. The image to the right is taken from the Dashboard of an existing SafeWorkPro user and shows which jobs have the most risk assessments associated with it. This information can tell a manager where most of their workforce is being used and which jobs require the most occupational health and safety procedures.
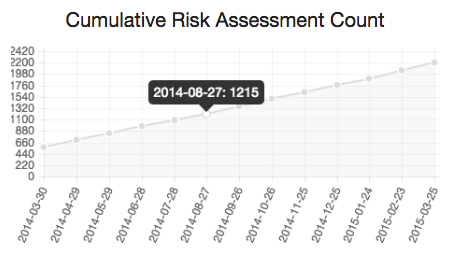
2: The cumulative safety document count
This line graph shows the number of risk assessments a business has produced over a long period of time. The data is broken into monthly figures, which provides managers with an insight into the number of completed safety documents as well as any rise or drop that strays from the overall trend.
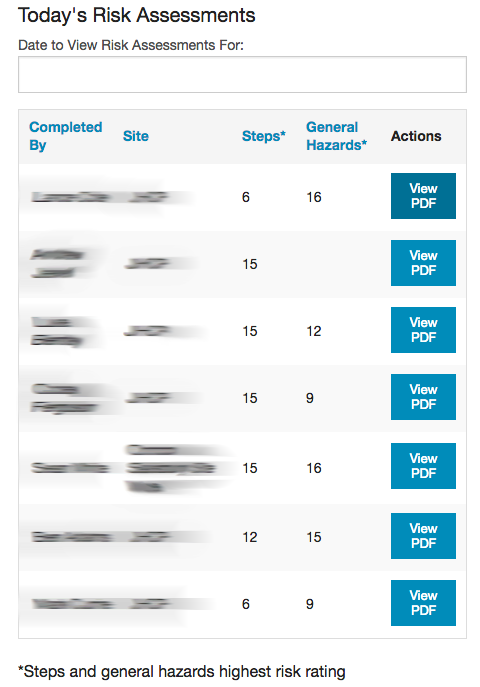
3: Today’s safety documents
Knowing who is doing a job is just as important as knowing what the job is. This part of the Dashboard shows which worker completed the safety document (in this case a risk assessment) for which job. The steps associated with the safety document are listed as well as the number of hazards. This instantly shows which job is the most risky and allows managers to review the completed safety document, thus improving the efficiency of how documents are shared and complied with.
This feature also allows managers to search for specific dates and find the safety documents associated with any job no matter how long ago it was finished. Moreover, a PDF of the document can be downloaded which makes satisfying compliance requests as easy as sending an email.
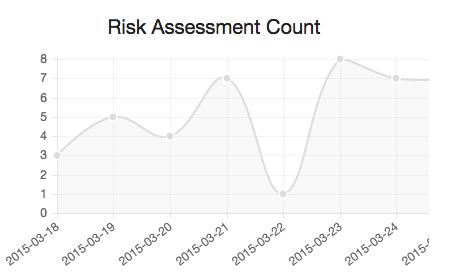
4: The safety document count
This line graph examines the number of safety documents completed on each day of any given week. It provides a short term insight into daily safe work practices conducted by workers as well as the OHS demands of each job on the respective day that it’s being worked on. For instance, on the left graph the number of completed safety
Summary
Although occupational health and safety is often viewed as a drain on time, it does not necessarily have to be. The Dashboard is the perfect place for managers looking optimise or streamline parts of their business. It benefits management by offering in-depth data that can be used as a basis for future decision making while it provides workers with an easy to use platform that tracks their current and past safety documents. In all, the Dashboard is another great feature for users of the SafeWorkPro software. If you would like to boost productivity without compromising workplace safety, try SafeWorkPro for free.


